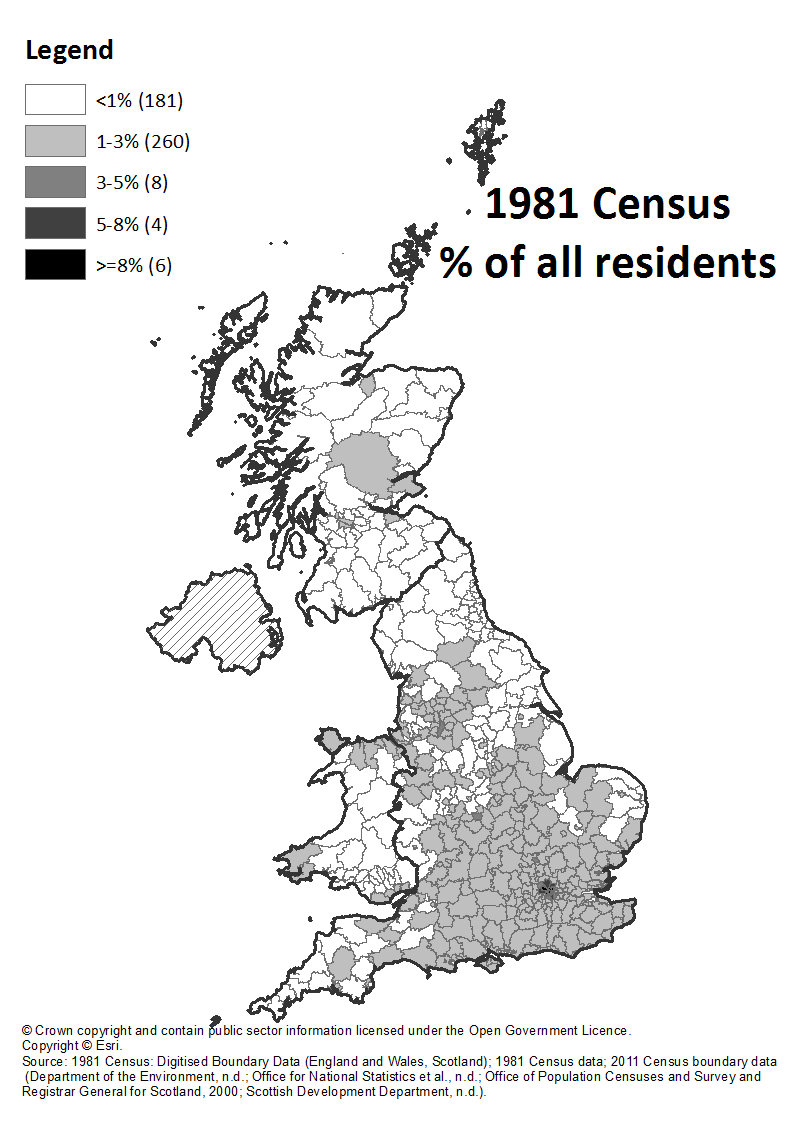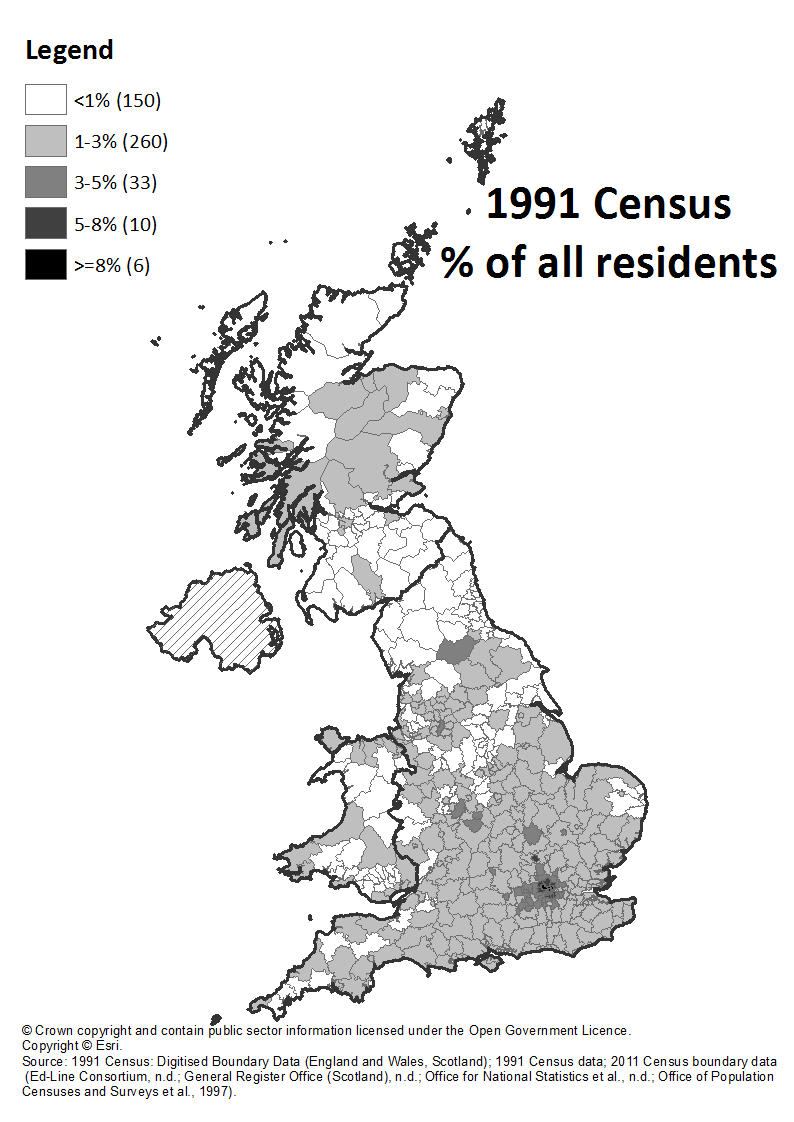
Over forty years of EU membership Britain has seen the population of resident EU nationals rising from 1.8% in 1981 to roughly 5% at the time of the EU referendum in 2016. We use official statistics to provide a historical overview of EU nationals in the UK since the early 1980s until the period around the EU Referendum in June 2016, focusing on the national picture as well as lower geographical areas.
The major change to the magnitude and distribution of EU nationals in the UK came after the 2004 Accession of New Member States (e.g. Czech Republic, Estonia, Hungary, Latvia, Lithuania, Poland, Slovenia, Slovakia, Cyprus, and Malta). But the report reveals this change was unevenly distributed among local areas.
At the time of the Brexit referendum, the geographical distribution of EU nationals in the UK mirrored that of 2011, with most EU nationals living close to big urban centres. The report however shows also marked differences in the patterns of settlement between EU14 (old EU member states) and EU10 (EU8 plus Romania and Bulgaria).
You can read our analysis of the changing profile of the population on non-UK EU nationals in the Britain in Eurochildren Research Brief no. 3.